Market Volatility
 Darrell Spence
 Robert Lind
 Jared Franz
As stocks and bonds continue to tumble after aggressive September interest-rate increases by central bankers in the U.S., Canada and England, investors are understandably asking how long this painful bear market will persist.
“It’s been a difficult year, and the pain may continue,” says Capital Group economist Darrell Spence. “But it’s important to keep in mind: One of the things that all past bear markets have had in common is that they eventually ended. Ultimately, the economy and the markets righted themselves.”
While past market results are not predictive of future results, it can be constructive to look at history. Based on the trajectory of past downturns, bear markets that were associated with a recession. tended to last, on average, about 18 months, Spence notes. So it wouldn’t be unusual for this one to continue well into 2023.
With recessions looming in the U.S., Canada and England — one may already be underway in Europe — it’s tough to see a catalyst for a near-term rebound, Spence says. Stocks and bonds are likely to come under further pressure as central banks continue to aggressively tighten monetary policy in an attempt to curb inflation, which is ranging from 7% to 10% in the U.S., Canada and England and above 10% in the European Union.
Stocks and bonds have tumbled this year as the U.S. Fed fights inflation
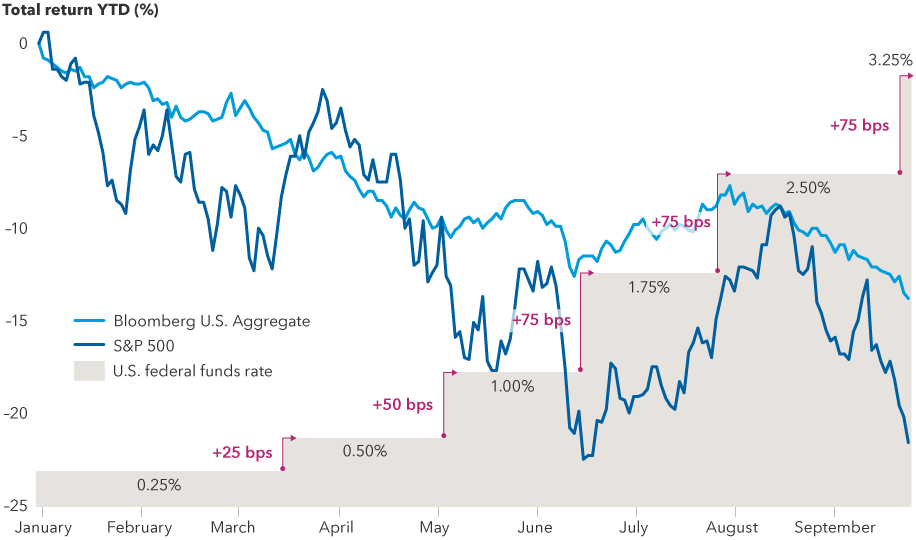
Sources: Capital Group, Bloomberg Index Services Ltd., Refinitiv Datastream, Standard & Poor’s. As of September 23, 2022. Returns are in USD.
Fed, Bank of Canada rate hikes shift into overdrive
Last week, the Fed raised its benchmark interest rate by 75 basis points for the third time since June. That hike brought the federal funds rate to a target range of 3.00% to 3.25%, the highest level since 2008. Based on the latest Fed projections, the central bank intends to take that rate above 4.50% in the months ahead.
Confirming the central bank’s hawkish stance, Fed Chair Jerome Powell said tighter financial conditions are necessary to achieve the goal of restoring price stability. That means bringing the inflation rate closer to the Fed’s 2% target.
“We have got to get inflation behind us,” Powell said during the Fed’s September 21 policy announcement. “I wish there were a painless way to do that. There isn't.”
It’s a similar story in Canada where the Bank of Canada (BoC) hiked rates by 75 basis points to 3.25% in September to fight inflation, which cooled slightly in July but is still running at levels not seen in decades.
“Inflation is too high,” BoC governor Tiff Macklem said after the September rate increase. “It is important that we get inflation back down so Canadians can plan their spending and savings, and they don’t get surprised by big changes in their cost of living,” he said.
The Bank of England (BoE) increased interest rates by 50 basis points in September to 2.25% pushing borrowing costs to the highest level since 2008.
Financial assets have declined sharply since the central banks’ September moves, weighed down by the realization that they and other central banks around the world may have to raise interest rates more than previously expected. The S&P 500 Index, the Dow Jones Industrial Average and the tech-heavy Nasdaq Composite are all in bear market territory, defined as a decline of 20% or more from a recent high. The U.S. bond market, as represented by the Bloomberg U.S. Aggregate Bond Index, is down about 14% in U.S. dollar terms on a year-to-date basis, as of September 23.
Mounting troubles in Europe
Markets have also come under pressure due to events outside the U.S., including Russia’s escalation of the war in Ukraine, an economic downturn in Europe and a controversial U.K. plan that has triggered fears of a fiscal crisis. The £45 billion package of tax cuts had included a proposal to drop the tax rate from 45% to 40% for the country’s highest earners. Although the tax rate proposal has since been scrapped, the original proposal sparked a violent gilt selloff. That selling threatened to trigger a liquidity crisis in the U.K. pensions sector until the BoE stepped in with two weeks of emergency bond purchases.
A European recession may already be underway due to the impact of higher energy prices, which have been exacerbated by the war, according to Capital Group European economist Robert Lind. A harsh winter could make matters worse, sending energy prices even higher.
“The depth and duration of the recession will depend largely on two factors: the war and the weather,” Lind says. “Both of which are impossible to predict.”
At the same time, Lind adds, the European Central Bank (ECB) and the BoE have no choice but to continue raising interest rates since they face the same elevated inflation levels as the United States. He expects the ECB and the BoE to raise rates through the fall and winter months.
The Fed pivot
Looking ahead to 2023, investors will turn their focus to another key question: When will central bankers stop raising rates or even start cutting again?
At the moment, there is little pressure for the Fed to change course, says Capital Group economist Jared Franz. Consumer spending is relatively healthy. The U.S. job market is extremely strong. And the unemployment rate remains near a record low of 3.7%.
But when the unemployment number starts moving higher — as it typically would during a recession — Fed officials will be forced to choose between fighting inflation and pushing millions of Americans out of work, Franz explains.
“It’s easy to talk tough on inflation when your unemployment rate is under 4%,” Franz says. “But what happens when it climbs to 6% or 7%? In my view, that’s about as much pain as the Fed is willing to accept. At the current pace of rate hikes, we’re on course to hit 7% unemployment in the second half of next year. I think it would be very tough to keep monetary policy tight in that environment.”
The BoC is walking the same tightrope as the Fed with the Canadian job market remaining strong. Although unemployment ticked higher to 5.4% in August from a record low of 4.9% seen in the previous two months, it remains near levels not seen since the early 1970s.
Money markets are betting on a BoC hike October 26 with one more in December or January to bring the central bank’s policy rate to about 4%.
The S&P 500 Index is a market capitalization-weighted index based on the results of approximately 500 widely held common stocks.
The Bloomberg U.S. Aggregate Bond Index represents the U.S. investment-grade fixed-rate bond market.
The NASDAQ Composite Index tracks the performance of more than 3,000 stocks listed on the NASDAQ and is often viewed as an indicator for the newer sectors of the economy.
The Dow Jones Industrial Average is an index of 30 of the largest blue-chip stocks in the U.S. market. The DJIA is a price-weighted index, as opposed to one that is market-cap weighted, such as the S&P 500.
Our latest insights
-
-
Global Equities
-
Artificial Intelligence
-
Technology & Innovation
-
RELATED INSIGHTS
-
-
Artificial Intelligence
-
Technology & Innovation
Commissions, trailing commissions, management fees and expenses all may be associated with mutual fund investments. Please read the prospectus before investing. Mutual funds are not guaranteed, their values change frequently and past performance may not be repeated.
Unless otherwise indicated, the investment professionals featured do not manage Capital Group‘s Canadian mutual funds.
References to particular companies or securities, if any, are included for informational or illustrative purposes only and should not be considered as an endorsement by Capital Group. Views expressed regarding a particular company, security, industry or market sector should not be considered an indication of trading intent of any investment funds or current holdings of any investment funds. These views should not be considered as investment advice nor should they be considered a recommendation to buy or sell.
Statements attributed to an individual represent the opinions of that individual as of the date published and do not necessarily reflect the opinions of Capital Group or its affiliates. This information is intended to highlight issues and not be comprehensive or to provide advice. For informational purposes only; not intended to provide tax, legal or financial advice. We assume no liability for any inaccurate, delayed or incomplete information, nor for any actions taken in reliance thereon. The information contained herein has been supplied without verification by us and may be subject to change. Capital Group funds are available in Canada through registered dealers. For more information, please consult your financial and tax advisors for your individual situation.
Forward-looking statements are not guarantees of future performance, and actual events and results could differ materially from those expressed or implied in any forward-looking statements made herein. We encourage you to consider these and other factors carefully before making any investment decisions and we urge you to avoid placing undue reliance on forward-looking statements.
The S&P 500 Composite Index (“Index”) is a product of S&P Dow Jones Indices LLC and/or its affiliates and has been licensed for use by Capital Group. Copyright © 2024 S&P Dow Jones Indices LLC, a division of S&P Global, and/or its affiliates. All rights reserved. Redistribution or reproduction in whole or in part are prohibited without written permission of S&P Dow Jones Indices LLC.
FTSE source: London Stock Exchange Group plc and its group undertakings (collectively, the "LSE Group"). © LSE Group 2024. FTSE Russell is a trading name of certain of the LSE Group companies. "FTSE®" is a trade mark of the relevant LSE Group companies and is used by any other LSE Group company under licence. All rights in the FTSE Russell indices or data vest in the relevant LSE Group company which owns the index or the data. Neither LSE Group nor its licensors accept any liability for any errors or omissions in the indices or data and no party may rely on any indices or data contained in this communication. No further distribution of data from the LSE Group is permitted without the relevant LSE Group company's express written consent. The LSE Group does not promote, sponsor or endorse the content of this communication. The index is unmanaged and cannot be invested in directly.
BLOOMBERG® is a trademark and service mark of Bloomberg Finance L.P. and its affiliates (collectively “Bloomberg”). Bloomberg or Bloomberg’s licensors own all proprietary rights in the Bloomberg Indices. Neither Bloomberg nor Bloomberg’s licensors approves or endorses this material, or guarantees the accuracy or completeness of any information herein, or makes any warranty, express or implied, as to the results to be obtained therefrom and, to the maximum extent allowed by law, neither shall have any liability or responsibility for injury or damages arising in connection therewith.
MSCI does not approve, review or produce reports published on this site, makes no express or implied warranties or representations and is not liable whatsoever for any data represented. You may not redistribute MSCI data or use it as a basis for other indices or investment products.
Capital believes the software and information from FactSet to be reliable. However, Capital cannot be responsible for inaccuracies, incomplete information or updating of the information furnished by FactSet. The information provided in this report is meant to give you an approximate account of the fund/manager's characteristics for the specified date. This information is not indicative of future Capital investment decisions and is not used as part of our investment decision-making process.
Indices are unmanaged and cannot be invested in directly. Returns represent past performance, are not a guarantee of future performance, and are not indicative of any specific investment.
All Capital Group trademarks are owned by The Capital Group Companies, Inc. or an affiliated company in Canada, the U.S. and other countries. All other company names mentioned are the property of their respective companies.
Capital Group funds are offered in Canada by Capital International Asset Management (Canada), Inc., part of Capital Group, a global investment management firm originating in Los Angeles, California in 1931. Capital Group manages equity assets through three investment groups. These groups make investment and proxy voting decisions independently. Fixed income investment professionals provide fixed income research and investment management across the Capital organization; however, for securities with equity characteristics, they act solely on behalf of one of the three equity investment groups.
The Capital Group funds offered on this website are available only to Canadian residents.