Investment Fund

Purchase Restrictions: Tax-exempt funds should generally not serve as investments for tax-deferred retirement plans and accounts.

Summary

Internal Prompt
A well-researched, broadly diversified approach for high tax-exempt income. With a strong focus on risk management, it provides exposure to a well-researched, broadly diversified portfolio of bond investments that are typically not available to retail investors, emphasizing higher yielding and lower rated municipal bonds.
Price at NAV $14.85 as of 4/18/2024 (updated daily)
Fund Assets (millions) $12,187.9
Portfolio Managers
3
Expense Ratio
(Gross/Net %)
0.65 / 0.64%

Internal Prompt

Returns at NAV

Returns with Sales Charge

Read important investment disclosures
3.11%
1-year return
1.61%
5-year return
3.51%
10-year return
3.94%
30-Day SEC Yield
Returns as of 3/31/24 (updated monthly). Yield as of 3/31/24 (updated monthly).

Asset Mix

U.S. Equities0.0%
Non-U.S. Equities0.0%
U.S. Bonds89.4%
Non-U.S. Bonds0.1%
Cash & Equivalents
10.5%
As of 3/31/2024 (updated monthly)

Growth of 10K

Read important investment disclosures
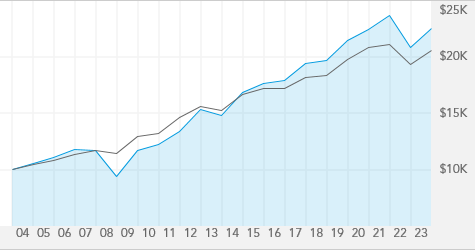
For Class A Shares, this chart tracks a hypothetical investment with dividends reinvested, over the last 20 years, or since inception date if the fund has been in existence under 20 years, through 12/31/2023.
AMHIX
Bloomberg Municipal Bond Index

High & Low Prices

Fund Statistics

7 years
Effective Duration
5%
Average Yield
to Maturity
4.5%
Average Coupon
% of net assets as of 3/31/2024 (updated monthly)

Morningstar Style BoxTM— Fixed-Income

No data is available at this time.

Description

Fund Objective
The fund's investment objective is to provide you with a high level of current income exempt from regular federal income tax.
Distinguishing Characteristics
This strategy offers investors opportunities for high federally tax-exempt income with a strong focus on risk management. It provides exposure to a well-researched, broadly diversified portfolio of bond investments that are typically not available to retail investors, emphasizing higher yielding and lower rated municipal bonds.
Types of Investments
Primarily invests in state, municipal and public authority bonds and notes. Normally, at least 80% of assets will be invested in tax-exempt securities. (May invest up to 100% of assets in bonds subject to the alternative minimum tax.) The fund will generally invest at least 50% of assets in debt securities rated Baa/BBB or below at the time of purchase, and 65% in securities rated A or below at the time of purchase, or unrated, but determined by the fund’s investment adviser to be of equivalent quality.
Maturity
Typically, the fund will be invested in intermediate- to long-term securities.

Fund Facts

Fund Inception 9/26/1994
Fund Assets (millions)
As of 2/29/2024
$12,187.9
Companies/Issuers
Holdings are as of 3/31/2024 (updated monthly).
1179+
Shareholder Accounts
Shareholder accounts are as of 3/31/2024
126,438
Regular Dividends Paid
Monthly
Minimum Initial Investment $250
Capital Gains Paid
Dec
Portfolio Turnover (2023) 26%
Fiscal Year-End Jul
Prospectus Date 10/01/2023
CUSIP 026545 10 3
Fund Number 40

Returns

Internal Prompt

Month-End Returns as of 3/31/24

Quarter-End Returns as of 3/31/24

Internal Prompt

Volatility & Return

Read important investment disclosures

Fixed-Income

For Class A Shares, this chart tracks the 10-year standard deviation
and 10-year annualized return of the fixed income funds
AMHIX
Bloomberg Municipal Bond Index
Other AF Funds
Standard Deviation as of 03/31/2024 (updated monthly) . Annualized return as of 03/31/2024 (updated monthly) .
VIEW LARGER CHART
Internal Prompt

Yield

12-month
Distribution Rates
30-day SEC Yield
Fund at NAV 3.81% N/A
Fund at MOP 3.66% 3.94%
As of 3/31/2024 (updated monthly)

Portfolio Management

Years of Experience with Fund
Years of Experience with Capital Group
Years of Experience with Investment Industry
Chad M. Rach 12 19 28
Jerome Solomon 6 15 32
Courtney K. Wolf 2 18
A boldface number indicates that years of experience with Capital Group is equal to years of experience with investment industry.

Ratings & Risk

Morningstar Rating TM


Overall Morningstar RatingTM
Funds rated(185)
3-yr. Morningstar RatingTM
(185 funds rated)
5-yr. Morningstar RatingTM
(176 funds rated)
10-yr. Morningstar RatingTM
(118 funds rated)
Overall Morningstar Risk Below Average
HIGH
LOW
Category High Yield Muni
Ratings are based on risk-adjusted returns as of 3/31/2024 (updated monthly).

Risk Measures

Fund
Standard Deviation
6.27
Sharpe Ratio
0.41
For the 10 Years ending 3/31/24 (updated monthly).
American Funds/
Morningstar Benchmark
Bloomberg Municipal TR USD
R-squared 88
Beta 1.17
Capture Ratio (Downside/Upside) 111/124
American Funds and Morningstar Benchmark for the 10 Years ending 3/31/24 (updated monthly).
AAA/Aaa
1.6%
AA/Aa
6.6%
A
11.6%
BBB/Baa
17.5%
BB/Ba
13.1%
B
2.5%
CCC & Below
1.1%
Unrated
35.6%
Cash & equivalents
10.5%
% of net assets as of 3/31/2024 (updated monthly)

Average Life Breakdown

0-4.9 Years
25.0%
5-9.9 Years
22.2%
10-19.9 Years
17.7%
20-29.9 Years
20.5%
30+ Years
4.1%
% of net assets as of 3/31/2024 (updated monthly)

Holdings

Bonds Breakdown

Bond Details

Total bond holdings
General obligation bonds 3.4%
Corporate bonds, notes & loans 0.2%
Mortgage-backed obligations 0.2%

% of net assets as of 3/31/2024 (updated quarterly)

Top Fixed-Income Issuers

Chicago Board of Education
2.2%
Commonwealth of Puerto Rico
2.1%
United Airlines Inc
1.8%
Puerto Rico Commonwealth Aqueduct & Sewer Auth ...
1.3%
Metropolitan Pier & Exposition Auth (Hyatt Reg ...
1.2%
Delta Air Lines
1.1%
COFINA
0.7%
Waste Pro USA Inc
0.7%
United States Virgin Islands Federal Excise Ta ...
0.6%
Main Street Natural Gas Inc Ga
0.6%

% of net assets as of 3/31/2024 (updated quarterly)

Geographic Breakdown

Colorado
9.4%
Illinois
7.6%
New York
6.3%
Texas
6.2%
California
6.1%
Florida
4.3%
Wisconsin
4.3%
Arizona
3.4%
Pennsylvania
3.3%
Ohio
2.7%
% of net assets as of 3/31/2024

Prices & Distributions

Internal Prompt

Historical Prices Month-End

Historical Prices Year-End

Internal Prompt

Historical Distributions as of 04/18/24

2024
Record
Date
Calculated
Date
Pay Date
Income Dividend Regular
Income Dividend Special
Cap. Gains Long-Term
Cap. Gains Short-Term
Reinvest NAV
Daily 01/31/24 02/01/24 $0.0484272 $0.00 $0.00 $0.00 $14.98
Daily 02/29/24 03/01/24 $0.0452079 $0.00 $0.00 $0.00 $15.04
Daily 03/28/24 04/01/24 $0.0496002 $0.00 $0.00 $0.00 $15.08
2024 Year-to-Date: Dividends Subtotal: $0.14323527 Cap Gains Subtotal: $0.00
Total Distributions: $0.14323527

Fees & Expenses

Internal Prompt

Fees

Annual Management Fees 0.27%
Other Expenses 0.10%
Service 12b-1 0.28%
As of each fund's most recent prospectus.
Internal Prompt

Expense Ratio

Gross Net
AMHIX 0.65% 0.64%
Lipper High Yield Municipal Debt Funds Average
0.83%
Fund as of most recent prospectus. Lipper Category as of 3/31/24 (updated quarterly).

Resources