Retirement Income
Categories
Retirement Income
Longevity: Don’t plan for an average retirement
 Kate Beattie
October 26, 2023
KEY TAKEAWAYS
- Life expectancy is underestimated. 53% of retirees underestimated or did not know the life expectancy of a 60-year-old American.1
- A simplistic approach to longevity planning may overlook a client’s health and lifestyle choices, which help determine a client’s lifespan.
- It is critical we help investors understand a more complete view of their life expectancy probabilities and the implications for retirement income planning.
Americans are living longer than ever before. Everyone knows that, it seems, except investors! Retirees frequently underestimate their life expectancy and the number of years they are likely to spend in retirement. It is critical we help investors understand their accurate life expectancy and the implications for retirement income planning. While the uncertainty of longevity cannot be eliminated, we can plan and manage for it. Let’s discuss why longevity, as well as life expectancy, need to be more forefront in retirement income planning conversations.
Figure 1. Life expectancy of a 65-year-old married couple
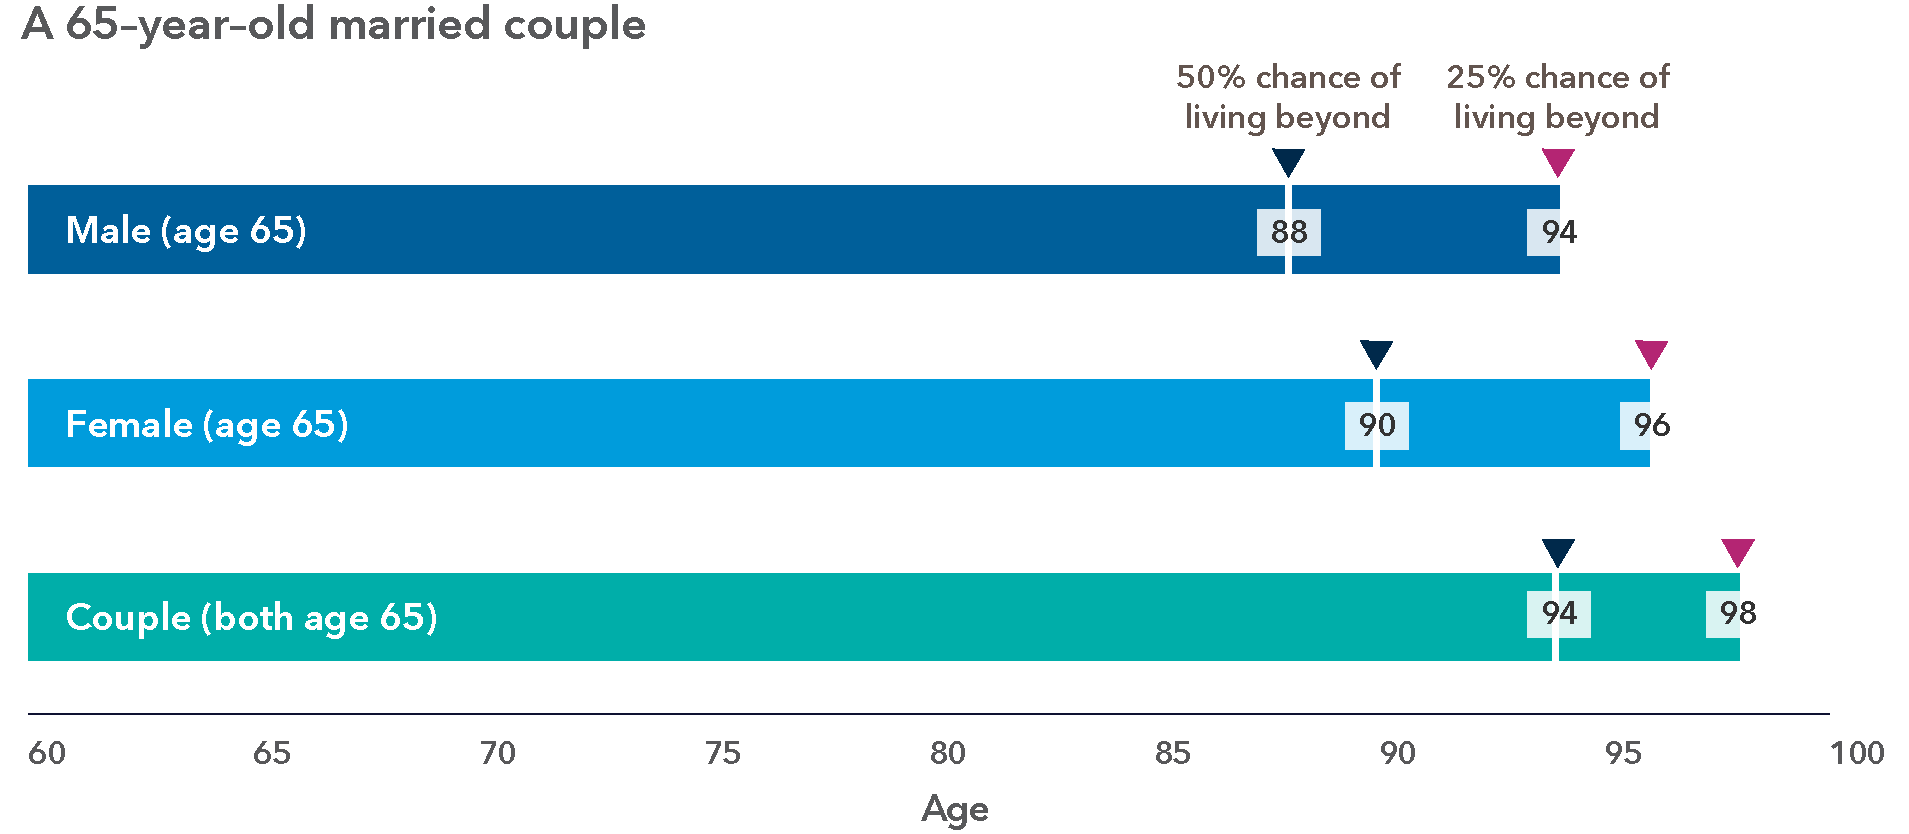
Source: Capital Group and Society of Actuaries and American Academy of Actuaries, Actuaries Longevity Illustrator, as of September 18, 2023.
What is life expectancy in the first place? Life expectancy from birth tends to be the statistic we hear most often: a man or woman born in a certain year has X average life expectancy. This information has little relevance for someone reaching retirement age. For example, it makes no sense for a female who has reached age 84 to base their retirement-planning horizon on the statistical average life expectancy from birth of 80 years.2 For the purposes of retirement income planning, a more relevant statistic is life expectancy at attained age. In fact, an 84-year-old non-smoking woman in excellent health has a 50% life expectancy of about eight years and a 10% probability of living for another 16 years.3 The median life expectancy probability (50%) for both males and females at age 65 is into the late 80s and, for couples, one spouse is expected to live into their 90s, as shown in Figure 1.4 But this picture can also mislead planning for a retirement income horizon because these statistics are based on the median probability of the entire population. While the term lifespan refers to the maximum number of years an individual can live, life expectancy refers to an estimate or an average number of years a person can expect to live. Many of your investors may have a survival probability that is much longer than the median as there are large differences in life expectancy depending on various economic and demographic factors.
Figure 2: Planning horizon from attained age 65
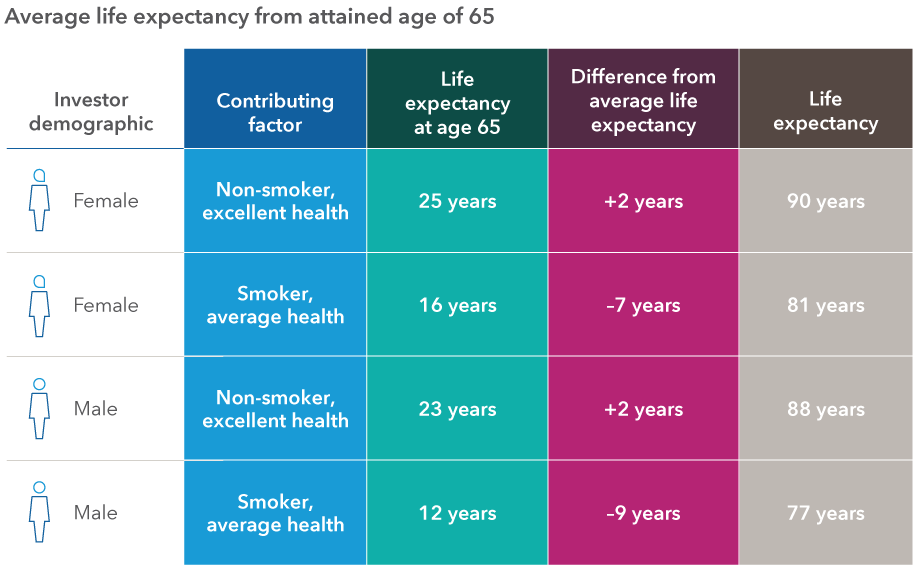
Source: Capital Group and American Academy of Actuaries and Society of Actuaries, as of September 18, 2023.
Contributing factors: OK if I smoke? To provide more perspective for clients, consider utilizing individual mortality factors such as gender, smoking choices and general state of health to sharpen the life expectancy probability.5 This will help to ensure the planning horizon matches up with their actual financial longevity risk and to provide your clients a more accurate picture of their retirement income horizon. For instance, suppose your investor is a 65-year-old woman who smokes and self-reports average health. Utilizing the Longevity Illustrator,6 she has a 50/50 chance of living at least another 16 years, to age 81, compared to age 90 if she were a non-smoker. But, as a smoker, she also has a 25% probability of living at least another 22 years, to age 87. And if she were a non-smoker, in average health, she would be likely to live another 29 years to age 94! This range illustrates the uncertainty surrounding how long someone might live and that longevity shouldn’t be viewed as a single point in time. These results may surprise many, considering that in a survey conducted by TIAA Institute, 53% of responders either did not know the life expectancy of a 60-year-old American, or underestimated it.7 Underestimation of life expectancy, together with having too short a planning horizon, can result in inadequate planning for retirement income needs. Incorporating contributing longevity factors beyond outliving the median statistics is a critical part of your client conversations.
Figure 3: Probability of living past of age 65
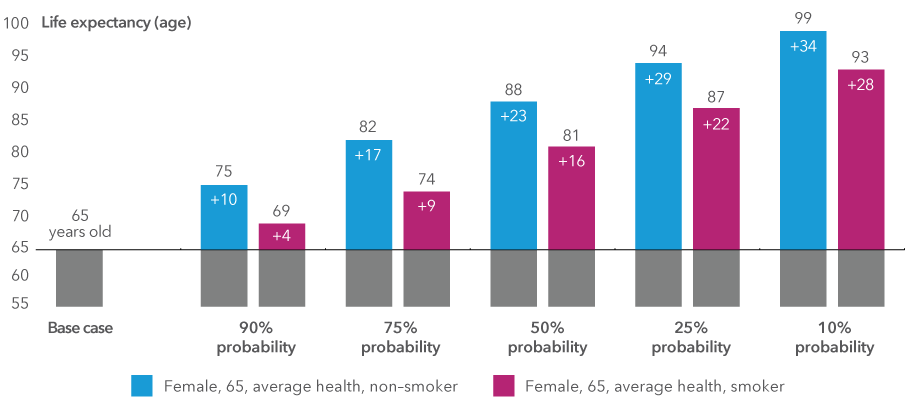
Source: Capital Group and American Academy of Actuaries and Society of Actuaries, as of September 18, 2023.
Reframing longevity with your clients: While the uncertainty of how long someone may live cannot be eliminated, you can help investors better understand their own unique probabilities and develop plans to reduce the likelihood they will outlive their financial resources.
Learn more about
1 TIAA Institute, Financial literacy, longevity literacy, and retirement readiness, 2022.
2 Social Security, 2020 Actuarial Life Table, as used in the 2023 Trustees Report.
3 American Academy of Actuaries and Society of Actuaries, Actuaries Longevity Illustrator, (accessed September 18, 2023).
4 Society of Actuaries and American Academy of Actuaries, Actuaries Longevity Illustrator. Based on a 65-year-old heterosexual non-smoking couple in excellent health (accessed September 18, 2023).
5 In terms of comparing your state of health to that of other people the same age and smoking status.
6 Relative to a client of same gender with average health and/or opposite smoking status.
American Academy of Actuaries and Society of Actuaries, Actuaries Longevity Illustrator (accessed September 18, 2023).
7 TIAA Institute, Financial literacy, longevity literacy, and retirement readiness, 2022.
Our latest insights
-
-
Retirement Income
-
Target Date
-
Practice Management
-
Participant Engagement
RELATED INSIGHTS
-
Retirement Income
-
Retirement Income
-
Target Date
Never miss an insight
The Capital Ideas newsletter delivers weekly investment insights straight to your inbox.
Investments are not FDIC-insured, nor are they deposits of or guaranteed by a bank or any other entity, so they may lose value.
Investors should carefully consider investment objectives, risks, charges and expenses.
This and other important information is contained in the fund prospectuses and summary prospectuses, which can be obtained from a financial professional and should be read carefully before investing.
Statements attributed to an individual represent the opinions of that individual as of the date published and do not necessarily reflect the opinions of Capital Group or its affiliates. This information is intended to highlight issues and should not be considered advice, an endorsement or a recommendation.
All Capital Group trademarks mentioned are owned by The Capital Group Companies, Inc., an affiliated company or fund. All other company and product names mentioned are the property of their respective companies.
Use of this website is intended for U.S. residents only. Use of this website and materials is also subject to approval by your home office.
On or around July 1, 2024, American Funds Distributors, Inc. will be renamed Capital Client Group, Inc.
This content, developed by Capital Group, home of American Funds, should not be used as a primary basis for investment decisions and is not intended to serve as impartial investment or fiduciary advice.